yasa.plot_hypnogram
- yasa.plot_hypnogram(hyp, sf_hypno=0.03333333333333333, highlight='REM', fill_color=None, ax=None, **kwargs)[source]
Plot a hypnogram.
New in version 0.6.0.
- Parameters
- hyp
yasa.Hypnogramor array_like A YASA hypnogram instance, or a 1D integer array where:
-2 = Unscored
-1 = Artefact / Movement
0 = Wake
1 = N1 sleep
2 = N2 sleep
3 = N3 sleep
4 = REM sleep
- sf_hypnofloat
The current sampling frequency of the hypnogram, in Hz, e.g.
1/30 = 1 value per each 30 seconds of EEG data,
1 = 1 value per second of EEG data
This has no impact if hyp is a
yasa.Hypnogram.- highlightstr or None
Optional stage to highlight with alternate color.
- fill_colorstr or None
Optional color to fill space above hypnogram line.
- ax
matplotlib.axes.Axes Axis on which to draw the plot, optional.
- **kwargsdict
Keyword arguments controlling hypnogram line display (e.g.,
lw,linestyle). Passed tomatplotlib.pyplot.stairs()and py:func:matplotlib.pyplot.hlines.
- hyp
- Returns
- ax
matplotlib.axes.Axes Matplotlib Axes
- ax
Examples
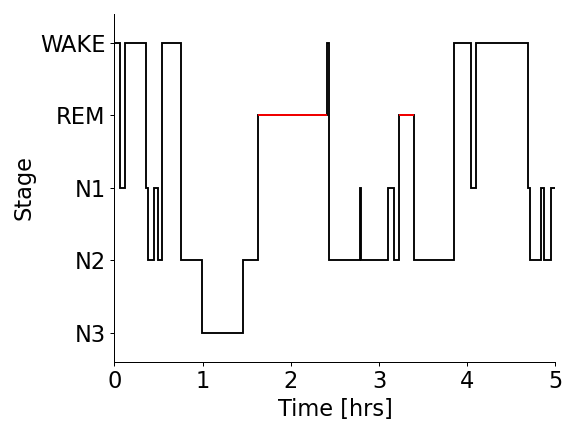
>>> from yasa import simulate_hypnogram
>>> import matplotlib.pyplot as plt
>>> hyp = simulate_hypnogram(tib=300, seed=11)
>>> ax = hyp.plot_hypnogram()
>>> plt.tight_layout()
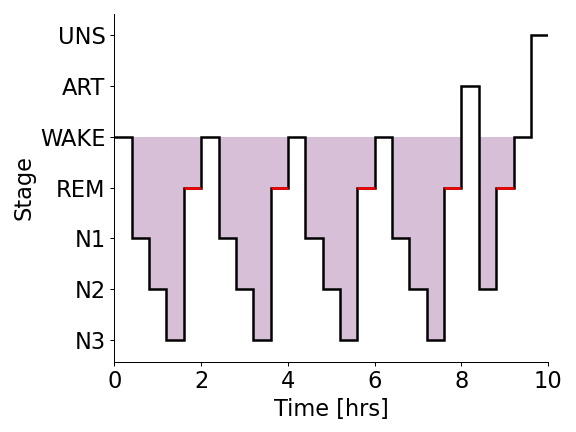
>>> from yasa import Hypnogram
>>> values = 4 * ["W", "N1", "N2", "N3", "REM"] + ["ART", "N2", "REM", "W", "UNS"]
>>> hyp = Hypnogram(values, freq="24min").upsample("30s")
>>> ax = hyp.plot_hypnogram(lw=2, fill_color="thistle")
>>> plt.tight_layout()
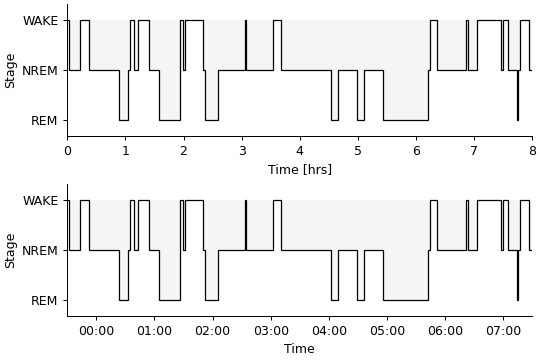
>>> from yasa import simulate_hypnogram
>>> import matplotlib.pyplot as plt
>>> fig, axes = plt.subplots(nrows=2, figsize=(6, 4), constrained_layout=True)
>>> hyp_a = simulate_hypnogram(n_stages=3, seed=99)
>>> hyp_b = simulate_hypnogram(n_stages=3, seed=99, start="2022-01-31 23:30:00")
>>> hyp_a.plot_hypnogram(lw=1, fill_color="whitesmoke", highlight=None, ax=axes[0])
>>> hyp_b.plot_hypnogram(lw=1, fill_color="whitesmoke", highlight=None, ax=axes[1])